
Tight End
Calculating TE
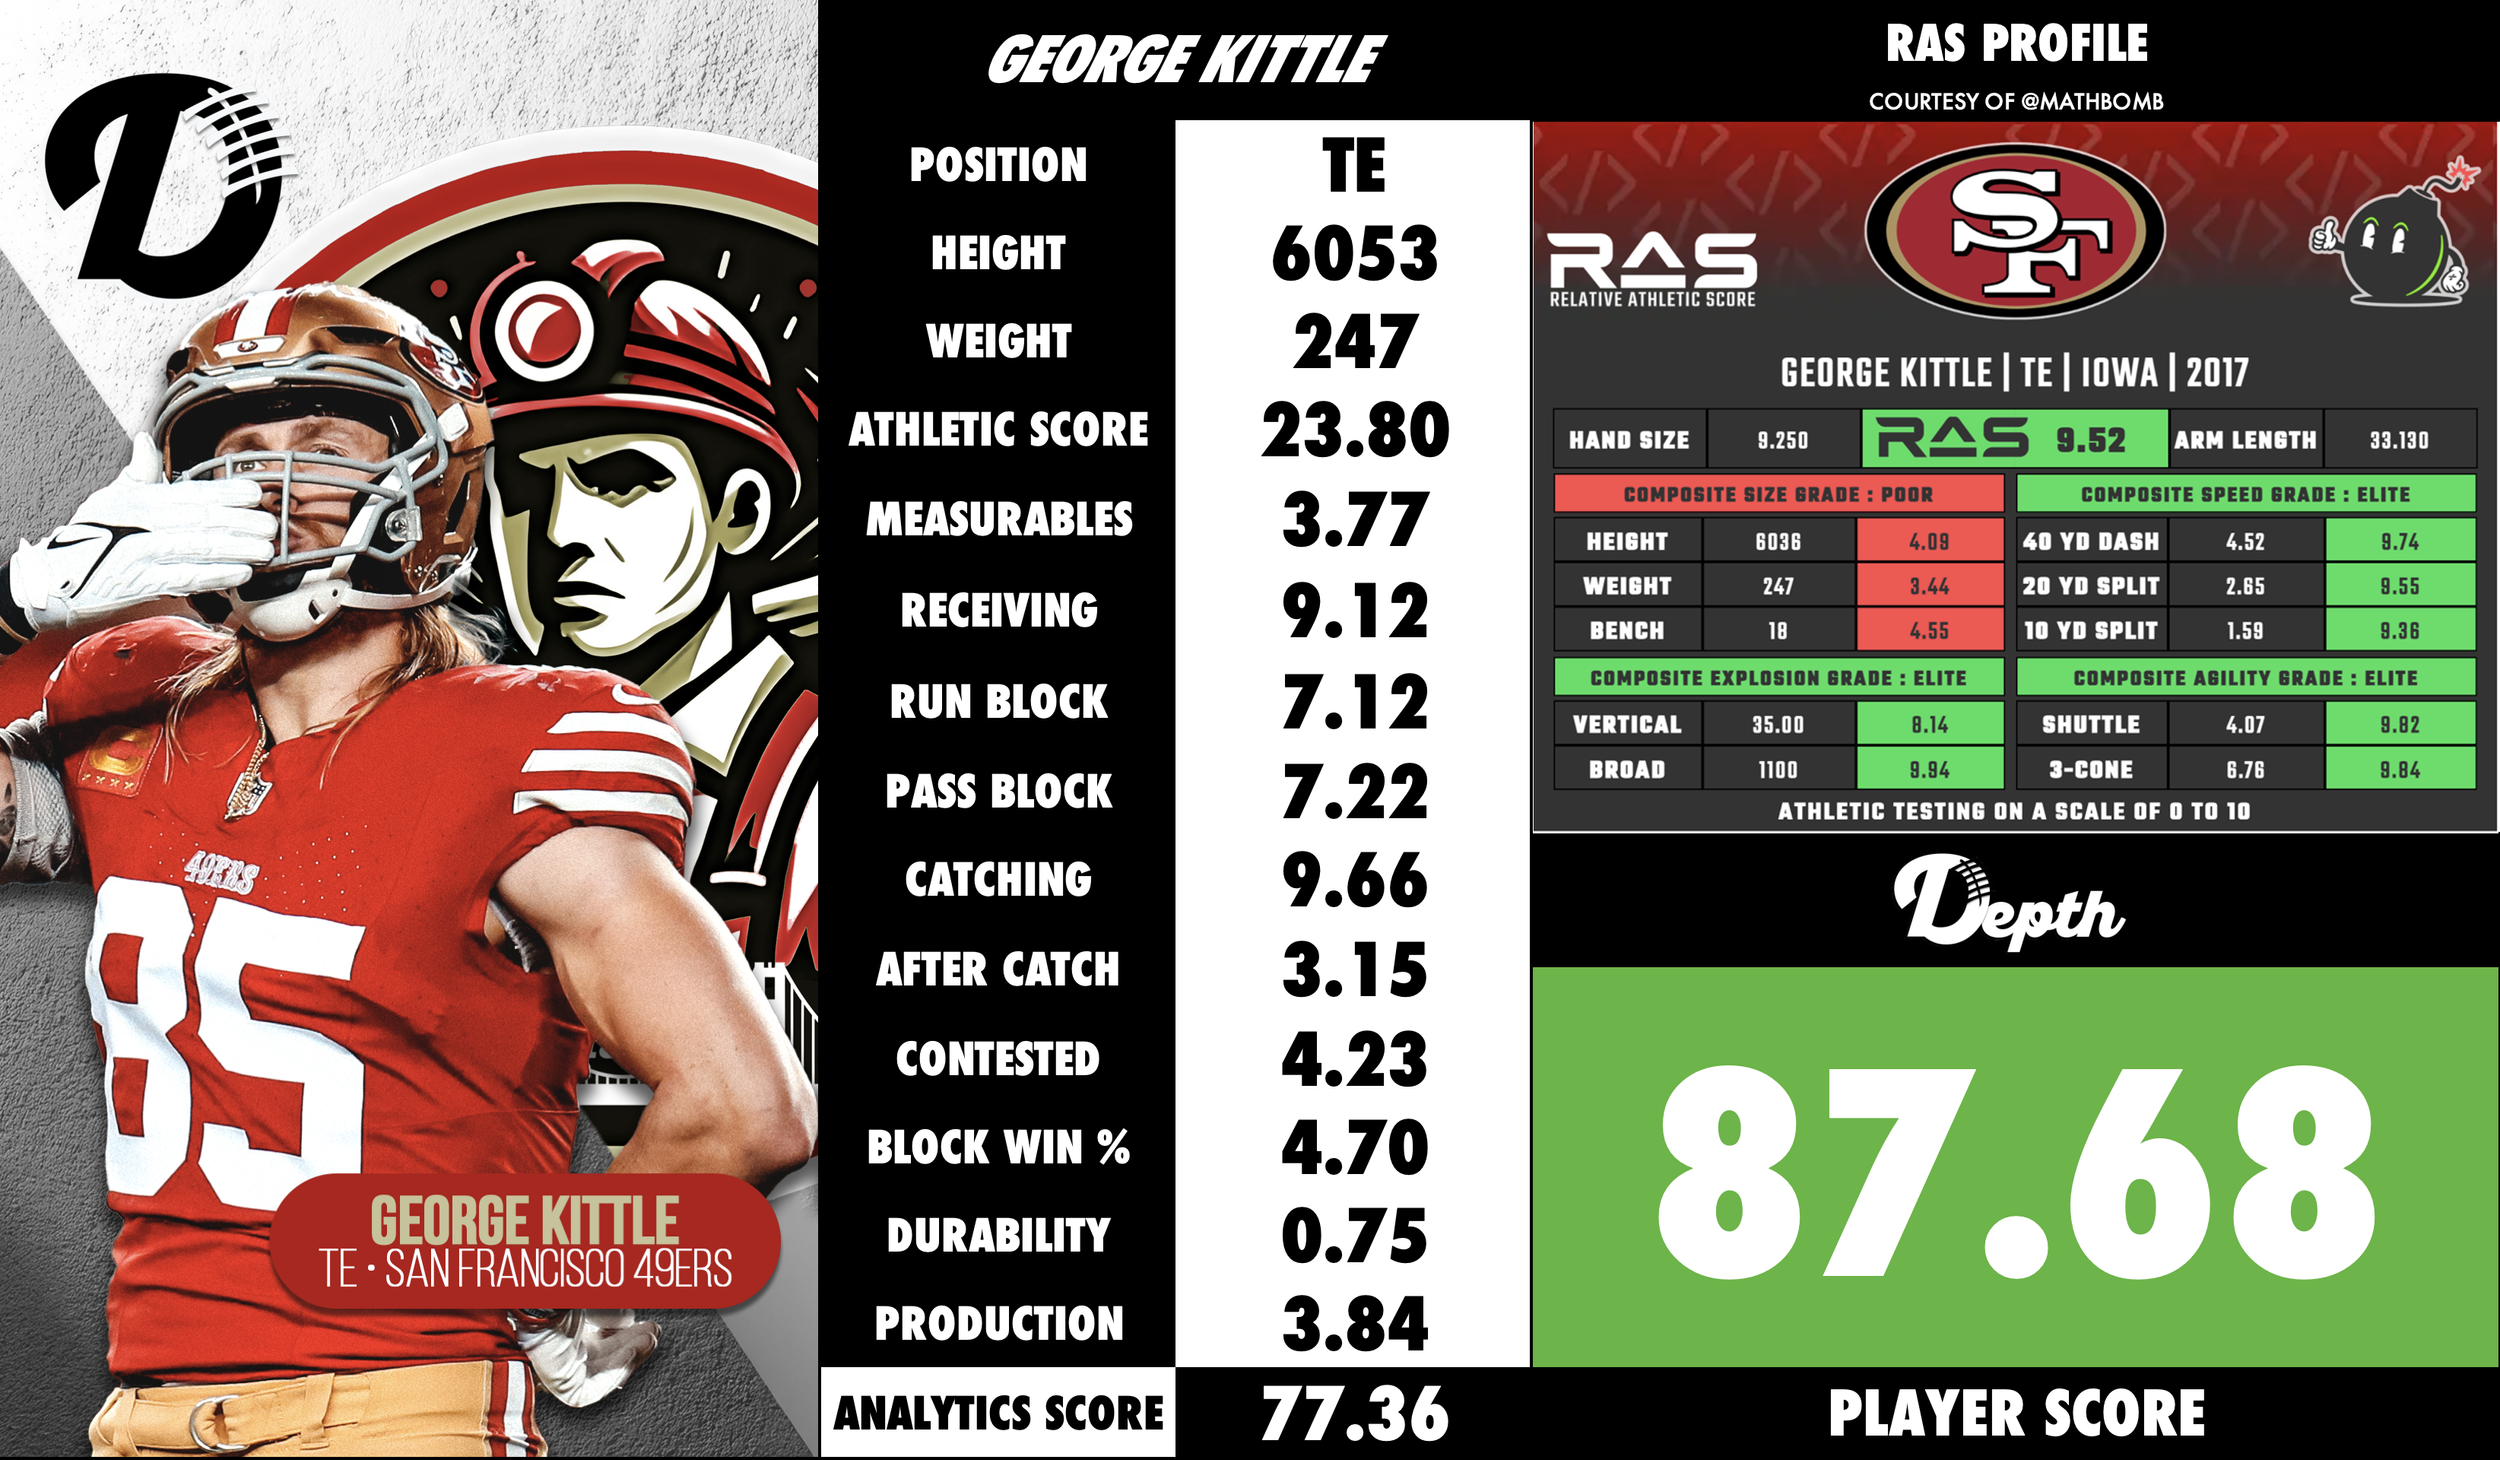
Depth Analytics Scores
Each team’s Top Two Tight Ends account for 10% of a Team’s Offense Score when calculating the roster grade.
So let’s break down how we create the Analytics score.
Athleticism (Up to 25 Total Points)
A Tight End’s athleticism is crucial for the position to help them outrun Linebackers and win in space in the pass and run game. This is calculated based off a player’s RAS score.
23-25 Elite Athleticism
20-22.99 Great Athleticism
15-19.99 Good Athleticism
10-14.99 Average Athleticism
5-9.99 Below Average Athleticism
4.99- Poor Athleticism
Measurables (Up to 10 Total Points)
Not every successful Tight End has to be made in a lab, but having more height and weight can help them win as both a blocker and catcher and reduce potential injury. This score is calculated based on the average of a player’s Height/Weight RAS composite.
9+ Elite Measurables
8 Great Measurables
7 Good Measurables
6 Average Measurables
5- Below Average Measurables
Receiving (Up to 10 Total Points)
This encompasses a Wide Receiver’s overall win rate when running short, mid, and deep routes and how active they are as a pass catcher. Calculated off metrics including Receiving Yards Over Expected and other advanced data metrics.
9+ Elite Receiver
8 Good Receiver
7 Average Receiver
6 Below Average Receiver
5- Poor Receiver
Run Blocking (Up to 10 Total Points)
Tight Ends need to be effective moving people in the ground game. Run Blocking score is comprised of run block win rate and other advanced data metrics.
9+ Elite Run Blocking
8 Good Run Blocking
7 Average Run Blocking
6 Below Average Run Blocking
5- Poor Run Blocking
Pass Blocking (Up to 10 Total Points)
Just like in the run game, Tight Ends need to be equally effective when it comes to buying some extra time in the pocket for the Quarterback. Pass Blocking score is comprised of pass block win rate and other advanced data metrics.
9+ Elite Pass Blocking
8 Good Pass Blocking
7 Average Pass Blocking
6 Below Average Pass Blocking
5- Poor Pass Blocking
Catching (Up to 10 Total Points)
Can the Tight End consistently bring in the ball? We calculate our catching score strictly off of Drop Rate.
10 Elite Hands (0.0% Drop Rate)
9.5-9.99 Great Hands
9-9.49 Good Hands
8.5-8.99 Average Hands
8.0-8.49 Below Average Hands
7.99- Poor Hands
After Catch (Up to 5 Total Points)
Catching the ball is one thing, but making magic with the ball in your hands after the catch is another. Calculated based off average Yards After Catch.
4.5+ Elite After Catch
4.0-4.49 Good After Catch
3.5-3.99 Average After Catch
3.4- Poor After Catch
Contested (Up to 5 Total Points)
It’s easy to make a wide open catch, but can you do haul it in with defenders draped all over you? Calculated based off various contested catch win rate metrics.
5 Elite Contested Catch (100.0%)
4-4.99 Good Contested Catch
3-3.99 Average Contested Catch
2.9- Poor Contested Catch
Block Win % (Up to 5 Total Points)
How efficient is Tight End at winning his 1v1 battles? Calculated off blocking efficiency metrics.
4.5+ Elite Run Blocker
3.5-4.49 Great Run Blocker
2.5-3.49 Average Run Blocker
2.49- Poor Run Blocker
Durability (Up to 5 Total Points)
Based off a player’s injury score and availability.
4.0+ Elite Durability
3.0-3.99 Great Durability
2.0-2.99 Average Durability
1.99- Poor Durability
Production (Up to 5 Total Points)
Forget everything else - what kind of numbers is the Tight End putting up? This is based off a player’s season receiving yards and total touchdown production. In some rare cases, you will see this number surpass the 5.00 cap if they had a record-breaking season.
4.0+ Elite Production
3.0-3.99 Great Production
2.0-2.99 Average Production
1.99- Poor Production
0.00- Rookie (No Production Yet Registered)