
Offensive Linemen
Calculating OL
Depth Analytics Scores
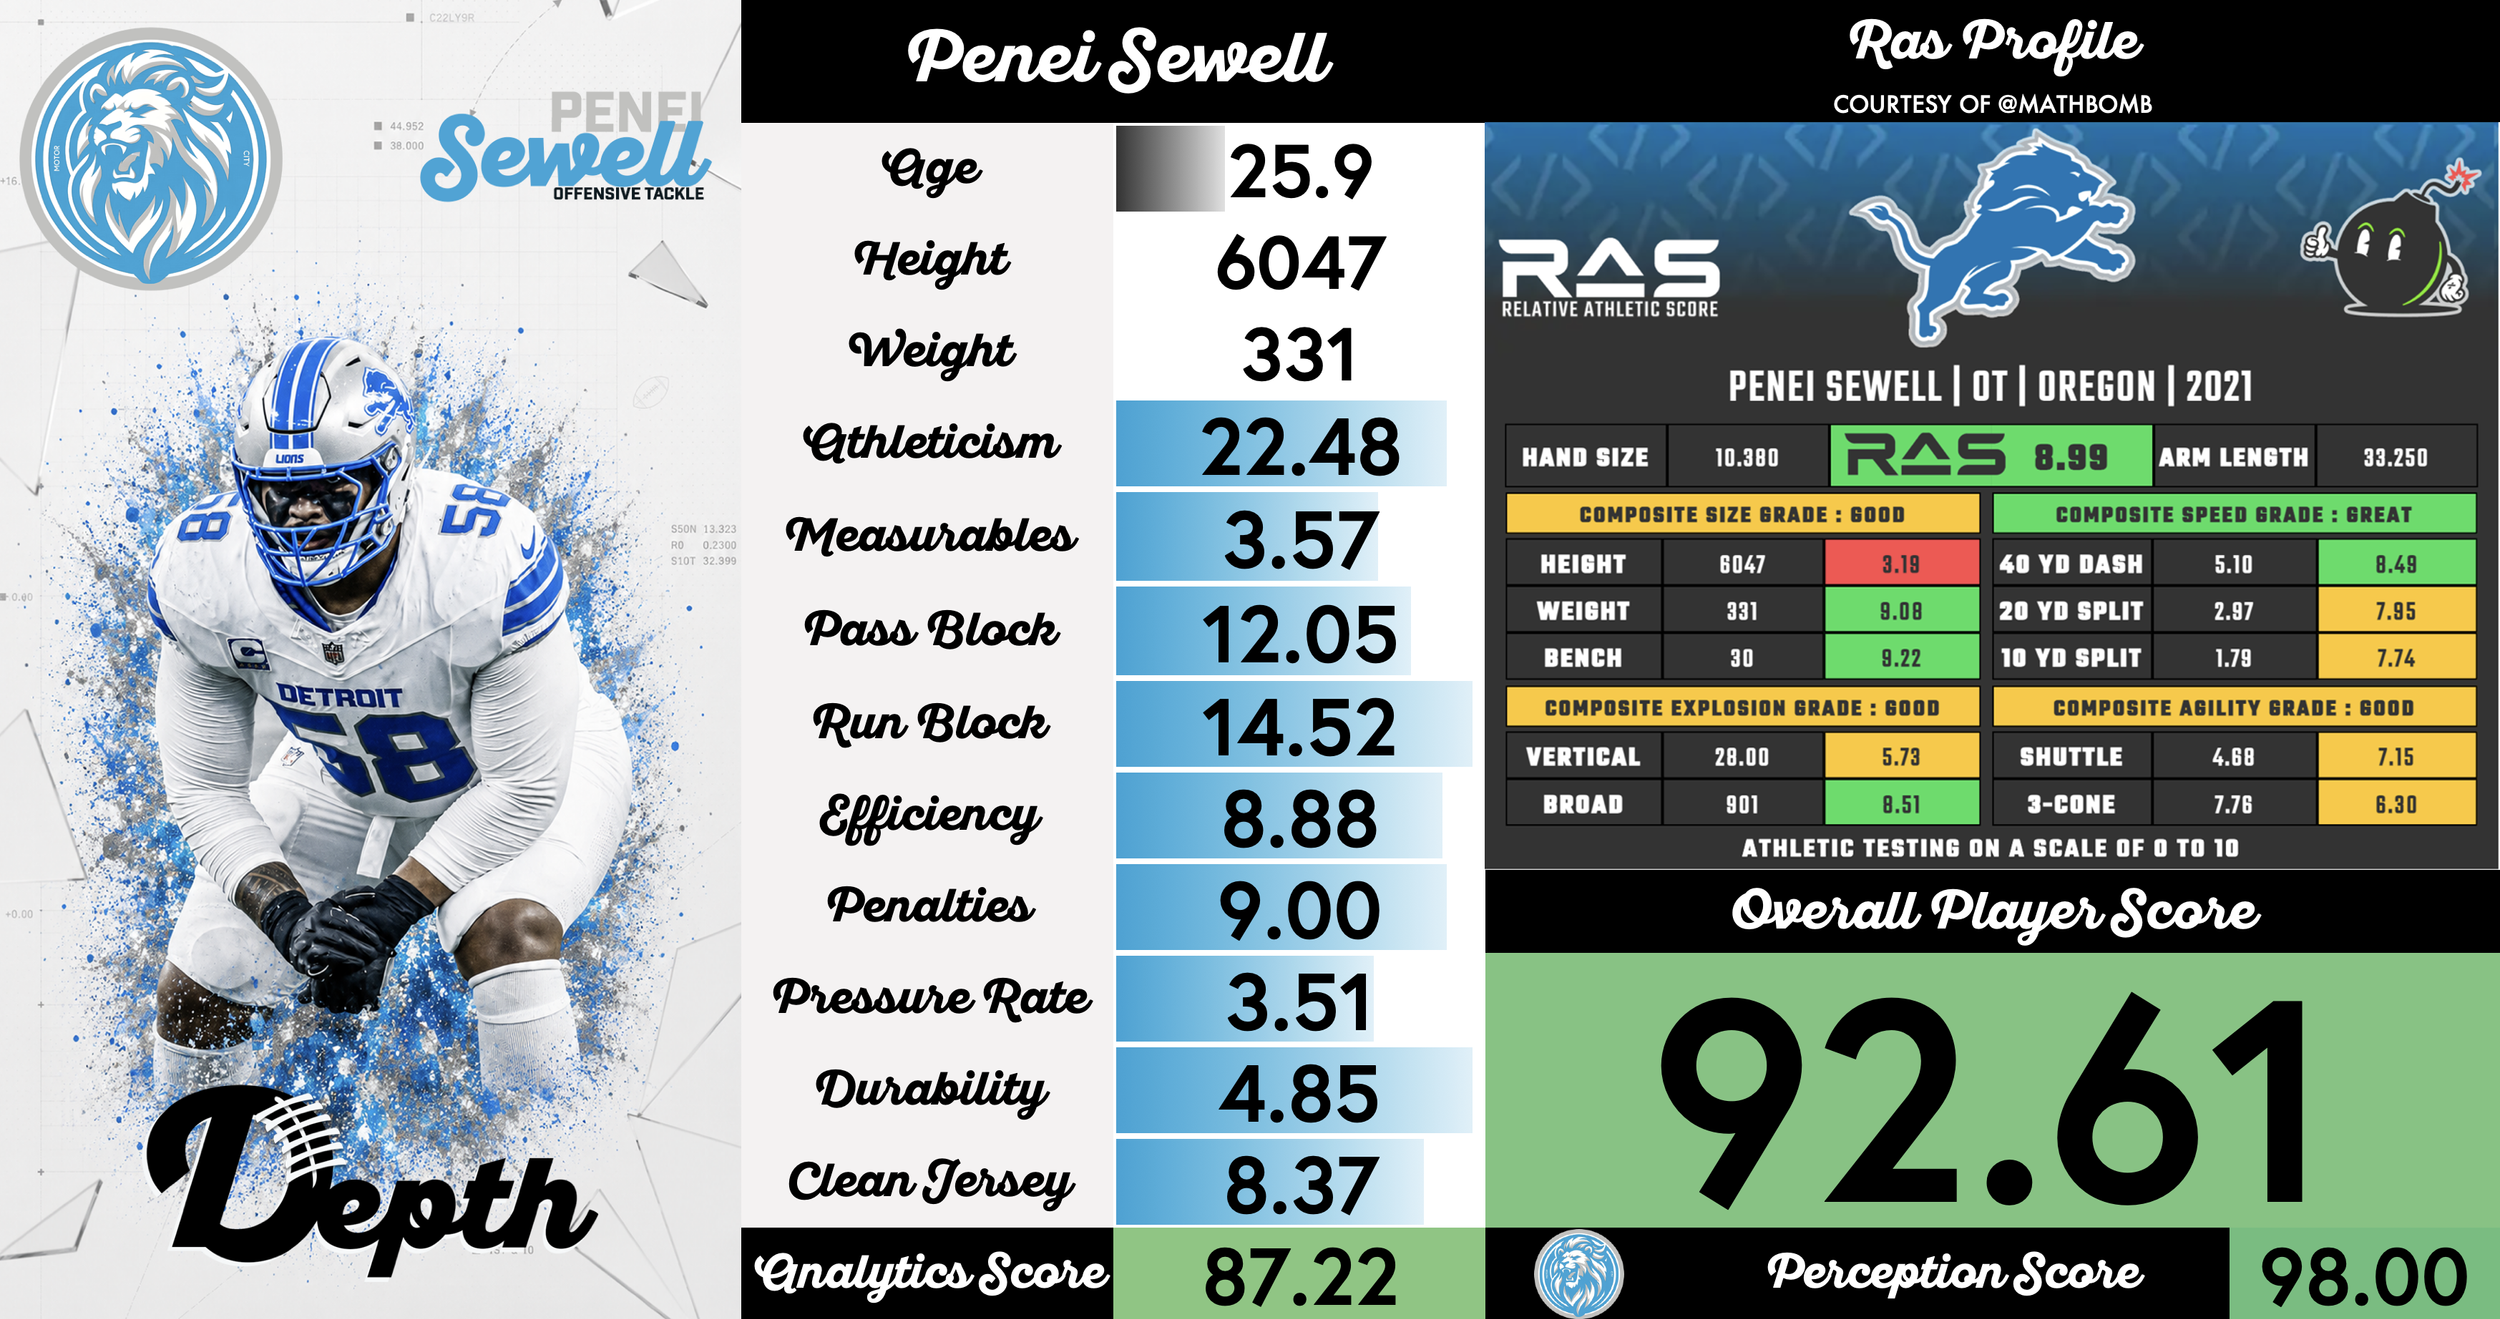
Each team’s Offensive Tackles account for 15% of a Team’s Offense Score when calculating the roster grade.
Each team’s Interior OL (Guards and Center) account for 15% of a Team’s Offense Score when calculating the roster grade.
That’s 30% of the entire Offense Score. It really does start in the trenches.
So let’s break down how we create the Analytics score.
Athleticism (Up to 25 Total Points)
An Offensive Lineman’s athleticism is crucial for the position to help them mirror twitchy pass rushers in pass protection and get out in space on screens and in the run game. This is calculated based off a player’s RAS score.
23-25 Elite Athleticism
20-22.99 Great Athleticism
15-19.99 Good Athleticism
10-14.99 Average Athleticism
5-9.99 Below Average Athleticism
4.99- Poor Athleticism
Measurables (Up to 5 Total Points)
Not every successful Tight End has to be made in a lab, but having more height and weight can help them win as both a blocker and catcher and reduce potential injury. This score is calculated based on the average of a player’s Height/Weight RAS composite.
4.5+ Elite Measurables
3.5-4.49 Great Measurables
2.5-3.49 Good Measurables
1.5-2.49 Average Measurables
1.49- Below Average Measurables
Run Blocking (Up to 15 Total Points)
Offensive Linemen need to be effective moving people in the ground game. Run Blocking score is comprised of run block win rate and other advanced data metrics.
13+ Elite Run Blocking
11-12.99 Good Run Blocking
8-10.99 Average Run Blocking
6-7.99 Below Average Run Blocking
5.99- Poor Run Blocking
Pass Blocking (Up to 15 Total Points)
It all comes down to keeping the Quarterback’s jersey clean, and that starts with an Offensive Lineman’s ability to pass protect. Pass Blocking score is comprised of pass block win rate and other advanced data metrics.
13+ Elite Pass Blocking
11-12.99 Good Pass Blocking
8-10.99 Average Pass Blocking
6-7.99 Below Average Pass Blocking
5.99- Poor Pass Blocking
Efficiency (Up to 10 Total Points)
How efficient is the Offensive Lineman at winning his 1v1 battles? Calculated off blocking efficiency metrics combined with hurries allowed.
10 Elite Blocking Efficiency
9.5-9.99 Great Blocking Efficiency
9-9.49 Good Blocking Efficiency
8.5-8.99 Average Blocking Efficiency
8.0-8.49 Below Average Blocking Efficiency
7.99- Poor Blocking Efficiency
Penalties (Up to 10 Total Points)
Discipline, both pre and post snap, is a huge area of emphasis for Offensive Lineman. If you keep getting flagged trying to get the job done, all the other good things you’re doing goes unnoticed. Every penalty committed is a half-point deduction, starting from 10 points.
10 Zero Penalties Committed
(0.50) Half Point Dropped Per Penalty Committed
0.00 20+ Penalties Committed
Pressure Rate (Up to 5 Total Points)
It’s simple - the job is to keep the quarterback’s pocket clean and give him time to operate. Calculated based off pressures allowed per snaps played.
4.5+ Stone Wall
3.5-4.49 Occasional Pressures Allowed
2.5-3.49 Frequent Pressures Allowed
2.49- Revolving Door
Durability (Up to 5 Total Points)
Based off a player’s injury score and availability.
4.0+ Elite Durability
3.0-3.99 Great Durability
2.0-2.99 Average Durability
1.99- Poor Durability
Clean Jersey (NEW) (Up to 10 Total Points)
Grass stains are discouraged! It’s extremely difficult to quantify an Offensive Lineman’s production, so we came up with a proprietary “Clean Jersey” metric that is calculated based the amount of times they allow their QB to be touched (hits and sacks) by pass sets played. Tide - if you’re reading this, let’s do a sponsorship.
10.0+ No Sacks, No Hits (Brick Wall)
8.0-9.99 Great Production (Minimal Sacks/Hits Allowed)
6.0-7.99 Average Production (Moderate Sacks/Hits Allowed)
5.99- Poor Production (Basically a Traffic Cone)
0.00- Rookie (No Production Yet Registered)