
Linebackers
Calculating LB
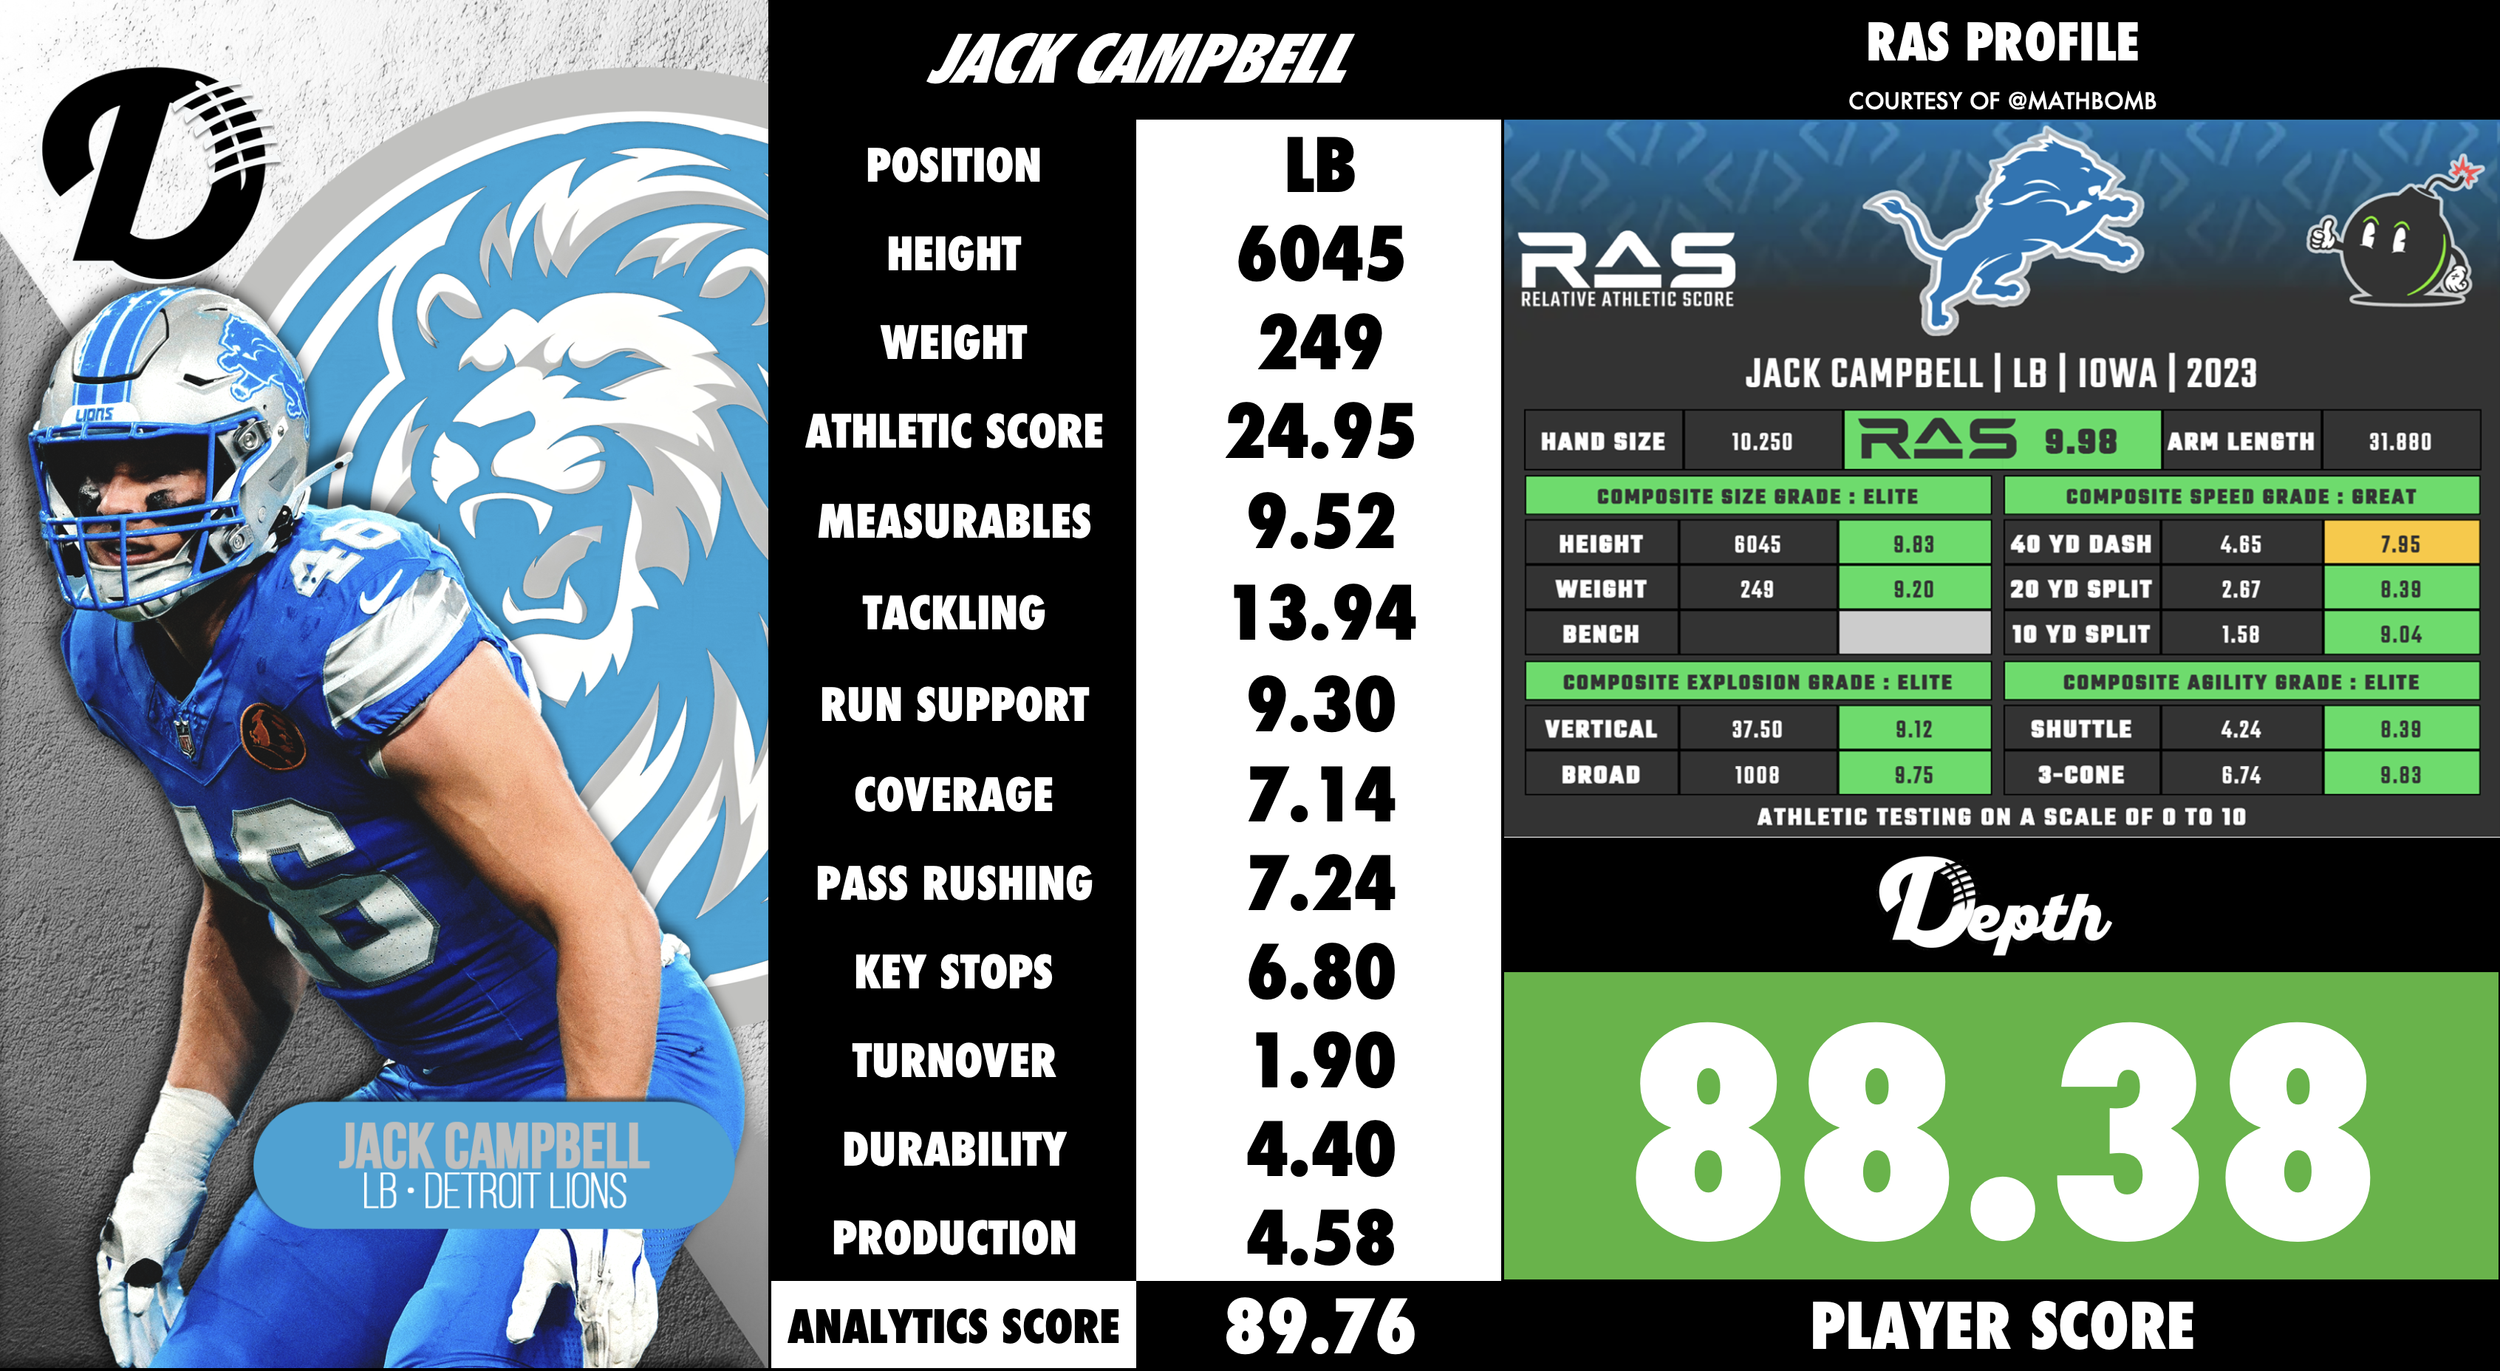
Depth Analytics Scores
Each team’s starting Linebackers account for 20% of a Team’s Defense Score when calculating the roster grade.
So let’s break down how we create the Analytics score.
Athleticism (Up to 25 Total Points)
A Linebacker’s athleticism and flexibility is crucial for the position to help them pursue ball carriers in the open field and drop back into coverages against Tight Ends and Running Backs. This is calculated based off a player’s RAS score.
23-25 Elite Athleticism
20-22.99 Great Athleticism
15-19.99 Good Athleticism
10-14.99 Average Athleticism
5-9.99 Below Average Athleticism
4.99- Poor Athleticism
Measurables (Up to 10 Total Points)
Not every successful Linebacker has to be made in a lab, but having more height and weight can help shed blocks and reduce potential injury. This score is calculated based on the average of a player’s Height/Weight RAS composite.
9+ Elite Measurables
8 Great Measurables
7 Good Measurables
6 Average Measurables
5- Below Average Measurables
Tackling (Up to 15 Total Points)
Tackling is the name of the game for Linebackers. Calculated off missed tackle percentages.
13+ Elite Tackler
10-12.99 Good Tackle
8-9.99 Average Tackler
6-7.99 Below Average Tackler
5- Poor Tackler
Run Support (Up to 10 Total Points)
This encompasses an Linebacker’s ability to shed blocks and close on the ball-carrier with expedited pursuit and aggression by utilizing data such as tackles for loss and tackle efficiency.
9+ Elite Run Support
8 Good Run Support
7 Average Run Support
6 Below Average Run Support
5- Poor Run Support
Coverage (Up to 10 Total Points)
Making tackles is great, but Linebackers need to have the ability to flip their hips and run with some of the most athletic Tight Ends. Calculated based on analytics that include average separation when targeted and completion percentage when targeted.
9+ Elite Coverage
8 Good Coverage
7 Average Coverage
6 Below Average Coverage
5- Poor Coverage
Pass Rush (Up to 10 Total Points)
As if tackling and covering is enough, the most complete Linebackers also offer a lot when it comes to blitzing from the second level. This grade is calculated off of pressure and successful blitz rates.
9+ Elite Pass Rusher
8 Good Pass Rusher
7 Average Pass Rusher
6 Below Average Pass Rusher
5- Poor Pass Rusher
Key Stops (Up to 5 Total Points)
The best Linebackers come up in the clutch. Calculated based on run stuff percentage and tackles made on third and fourth downs, among other advanced metrics.
4.5+ Elite Key Stops
4.0-4.49 Good Key Stops
3.5-3.99 Average Key Stops
3.4- Poor Key Stops
Turnover (Up to 5 Total Points)
Good things happen to players that attack the ball. Grade is based on how much chaos a Linebacker causes in creating strip sack fumbles, fumble recoveries, and interceptions. Batted passes are also incrementally accounted for here.
4.5+ Elite Turnover Demon
3.5-4.49 Great Turnover Machine
2.5-3.49 Average Turnover Artist
2.49- Poor Turnover Player
Durability (Up to 5 Total Points)
Based off a player’s injury score and availability.
4.0+ Elite Durability
3.0-3.99 Great Durability
2.0-2.99 Average Durability
1.99- Poor Durability
Production (Up to 5 Total Points)
Forget everything else - what kind of numbers is the Linebacker putting up? To keep this simple and straight-forward, this is based off single-season tackle numbers. In some rare cases, you will see this number surpass the 5.00 cap (150 Tackles) if they had a record-breaking season.
4.0+ Elite Production (96+ Tackles)
3.0-3.99 Great Production (72-95 Tackles)
2.0-2.99 Average Production (48-71 Tackles)
1.99- Poor Production (0-47 Tackles)
0.00- Rookie (No Production Yet Registered)